|
|
UNIT 4
Adding Images and Charts
|
|
See our entire collection of online tutorials |
|
|
|
|
Try adding a star shape to your slide, using the Shapes tool in the Illustrations Group in the Insert tab.
|
|
3. When the star is positioned where you want it, release the mouse button. |
|
2. Click the arrow beside the Fill Color button (found in the Drawing Group in the Home tab, or in the Shape Styles Group in the Format tab, or in the Formatting Menu when do a right-click), and then click More Fill Colors. A Colors dialog box appears.
2. Click the arrow beside the Fill Color button, then select Texture. The Texture tab appears. 3. Click on a texture you like. The texture is applied.
|
|
|
|
Now you're talkin'. I love it! |
Adding clip art
Try adding a fish image to your slide.
3. Type "fish" in the search box and click Go.
Note: Some built-in slide Layouts in PowerPoint already have placeholders for clip art. To insert clip art into one of these slides, simply click the placeholder and the clip art gallery will open. |
|
2. Place the pointer on a resizing handle. The pointer will change into a two-headed arrow.
4. When the image is the size you want, release the mouse button. |
|
The following steps will show you how to crop an image.
5. When enough of the image has been cropped, release the mouse button. You can use the other crop handles to crop other parts of the image if you want. 6. Click outside the picture to turn the cropping tool off.
|
|
|
|
Let's say you've used a graphics program to create an amazing logo for your school, and you want to insert the logo into your PowerPoint presentation. Here's how to do it:
3. In the File name box, enter the name of the file. Then click the Insert button.
|
|
|
|
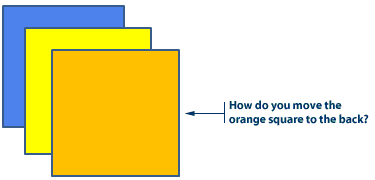
You want to send the orange square to the back layer. How do you get it there?
Try these steps:
2. In the Drawing Group in the Home tab, click on the Arrange button. A drop-down menu appears. 3. From the list, click on Send to Back. Alternatively, click the Drawing Tools tab or Format tab, go to the Arrange Group and then click the Send to Back button.
2. In the Drawing Group in the Home tab, click the Arrange button and from the drop-down menu select Bring to Front. Alternatively, click the Drawing Tools tab or Format tab, go to the Arrange Group and then click the Bring to Front button.
|
|
|
2. In the Shape Styles Group located in the Drawing Tools tab, or in the Drawing Group in the Home tab, click the arrow beside the Shape Effects button. From the drop-down menu, click Shadow. 3. Another window appears beside the drop-down list with all the style options you can choose from for a shadow. Hold your mouse over any style to see an instant preview of it on the selected shape. Click on the style you like and it will be applied.
|
|
|
|
Some slide AutoLayouts have placeholders for charts. To insert a chart into one of these layouts, just click the chart placeholder.
You will see sample data in the first four columns. The bars in the chart are the graphical representation of the numbers in the data sheet. Notice how a higher number in the data sheet results in a taller corresponding bar.
2. Type in the number 50, then press Enter. The corresponding bar on the chart increases in height.
3. Try adding other numbers into the data worksheet to see how they affect the bars.
|
If you need to make any revisions to the chart data, click the chart to select it, then click on the Design tab that appears along with Chart Tools contextual tool tab. In the Data group, click on the Show Data button. Excel 2007 will open again in a split window with a worksheet containing all the table's data. Edit the appropriate cells and save. The changes made will appear in your chart.
|
|
|
|
2. Notice how a new set of bars appears in the chart.
2. Click on the Table Tools tab of Excel's Ribbon and then click on the Layout tab. Go to the Table Group. Click the downwards arrow of the Select button. Choose the Select Column (or Row) button. 3. Now go to the Rows & Columns Group which is also in the Layout tab. Click on the downwards arrow of the Delete button. 4. Click the Delete Columns button. Column D is now removed from the data worksheet and the corresponding bar also disappears from the chart.
When a chart is selected, the Chart Tools contextual tool tab automatically appears. Click on this tab to make it visible.
The Chart Tools contextual tool has 3 of its own tabs: Design, Layout and Format. Everything you could possibly want to alter in a chart is available in these 3 tabs from adding a title to your chart to picking out a color style.
|
|
|
|
The following steps show you how to convert the bar chart to a pie chart:
2. In the Type Group, click on Change Chart Type. The Chart Type dialog box appears.
|
|
|
|
|
|
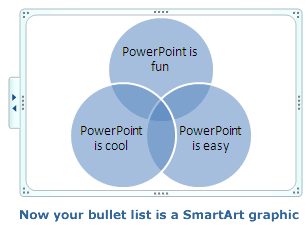
As a chart is used to transform numeric data into a visual aid, a SmartArt graphic does the same thing for text such as lists. A SmartArt graphic can be simple or complex. SmartArt offers a wide range of shapes, designs, layouts and color schemes. Of course, if you don't like an element of a built-in SmartArt graphic, it's color scheme for example, PowerPoint makes it easy for you to do changes. You can convert existing text on a slide into a SmartArt graphic, or you can pick a SmartArt graphic first and then add your text to it. Follow these steps to create a List style SmartArt graphic for your slide.
Whenever the SmartArt graphic is selected, the SmartArt Tools contextual tool appears with its 2 tabs on the Ribbon: Design and Format. You use the SmartArt Tools to make all your formatting and style changes.
Just as you've done with shapes and text boxes already, you can move and re-size the SmartArt graphic. What's a little different though, is that you can even move and re-size the individual text shapes within the SmartArt graphic too. It's done the same way. You click on one of the text shapes to select it. The dashed border with re-sizing handles appears. Now you can re-size or move the text shape. To make precise changes in size of a shape or the whole SmartArt graphic, there is the Size tool in the Format tab you can use.
You can also change the format of the text using the Font Group in the Home tab, as well as how it looks by using the tools in the Format tab in SmartArt Tools: Text Fill, Text Outline, Text Effects and WordArt.
Finally, you might decide the layout you originally chose isn't quite right. In the Design tab in SmartArt Tools, go to the Layout Group. Click on the downwards pointing arrow and all the layout options will appear. As usual, hold your mouse over a layout to see an instant preview on the SmartArt graphic. Click on a layout and it will be applied.
Follow these steps to change a bullet list to a SmartArt graphic:
|
|
|
|
|
|
|
2. Select a table with a certain number of columns and rows from the grid in the drop-down list that appears, or click on Inert Table from the drop-down list. From the Insert Table dialog box, choose the number of rows and columns you want for your table.
Next, you will type information into the table.
2. Type the word January. 3. Press the TAB key on your keyboard. The insertion point is now in the second column of the first row. 4. Type the word February. 5. Press the TAB key to move to the next column, and type the word March. Navigation Tips: To move to a previous column in a row, press SHIFT + TAB. You can also move around the table by simply clicking where you want to move to, or by using the arrow keys on your keyboard. After you've finished typing, click outside the table to exit edit mode.
|
|
|
In PowerPoint you can adjust the height and width of the cells. The following steps will show you how to adjust the height and width of cells in your table.
2. First, try making the cells in the first column narrower. (a) Place the pointer on the gridline between the first and second column. The pointer will change into a two-headed arrow.
(c) Click and drag the gridline to the right to make the cells wider again.
(a) Place the pointer on the gridline between the first and second rows. The pointer will change into a two-headed arrow. (b) Click and drag the gridline downwards. The cells become taller. (c) Click and drag the gridline upwards to make the cells shorter again. |
|
|
Try jazzing up your table as follows.
2. Other formatting features of a table are changed by using the Layout tab in Table Tools such as adding/deleting cells, cell size, alignment and table size.
If you don't like what you've done, you can always undo a step, or even clear all the formatting you've done. In the Table Styles Group in the Design tab, click on the downwards pointing arrow. In the drop-down list that appears, select Clear Table.
|
Is a picture really worth 1,000 words? That depends on the image. Some may be worth only 10 words, while others might be enough to inspire an entire set of encyclopedias. In any case, if you add images to your PowerPoint presentation, it's going to make your information more valuable and a lot more interesting for your audience. Images not only add important visual info to your presentation, they also give your audience a necessary break from looking at big blocks of text. Where do you get images?
CD-ROMs
Royalty-free CDs feature all varieties of subjects, from exotic vegetables to African jungle animals. Many of these affordable CDs - about $40 U.S. - include thousands of different clip-art drawings and/or photo images. It's also possible to buy individual images on the Internet for about $10 U.S. each. Depending on how many you want to use, it may be cheaper to buy the entire CD. Use Google and search for "royalty free images" and you will find a list of sites.
The World Wide Web
It's also up to you to set a good example. E-mail the Webmasters to ask for permission to use specific content - and tell them why your students want to use it. Chances are, they will be flattered when they find out how much you like their work. Just include your name and your school - and be prepared to wait a few days for a reply. Try saving this picture by following these instructions:
2. Click your right mouse button. A pop-up menu will appear. 3. Select Save Picture As in the pop-up menu. The Save Picture window will appear. 4. Type a name for the image into the Save Picture window and find a directory to store it in. 5. Click the Save button.
Adding clip-art to the PowerPoint ClipGallery
To add clip-art images to the PowerPoint ClipGallery:
2. In PowerPoint, click the Clip Art tool in the Illustrations Group in the Home tab. 3. Select the "Clip Art on Office Online" link in the Clip Art task pane. This will automatically open your Web browser and take you to the Clip Art section of Microsoft Office Online. 4. Search the collections for images you want. Click on the thumbnails to see the larger version. When you decide on a Clip Art you want, you can click the copy this item to your clipboard icon beneath the thumbnail. You can then paste the Clip Art into PowerPoint 2007. To actually download clip art to your computer, you need to do a few steps. First click the check box underneath the thumbnail. The Clip Art is added to the Selection Basket in the menu pane on the left side of the web page. Add as many more clips as you want to your basket. When finished, click Download items. 5. A new window opens up with the available saving options. Pick which option best suits you and then click the Download Now button. Click OPEN if you are asked, "Do you want to open this file?" 6. The Clip Art is then downloaded and automatically saved to your computer in the Downloaded Clips folder in the My Collections folder in the Collection List in the Microsoft Clip Organizer of PowerPoint 2007. 7. The downloaded Clip Art is immediately available now in PowerPoint 2007. In the Clip Art task pane you can click Organize clips... link to open the Microsoft Clip Organizer and edit your clips. Note: you can also download pictures, sounds and animations from the ClipGallery Live site. |